

AI-Powered Campaign Analysis: The Smarter Way to Do Email Marketing
AI-Powered Campaign Analysis: The Smarter Way to Do Email Marketing
Get real-time grades, industry benchmarks, trend detection, and actionable recommendations — all powered by AI. No more guessing what works.
Every email you send generates data. Open rates, click rates, bounces, unsubscribes — the numbers pile up after every campaign. The problem? Most marketers glance at these metrics, feel good (or bad), and move on without knowing what to actually change.
That’s the gap MailerCloud’s AI-powered campaign analysis fills. Instead of staring at spreadsheets, you ask a question in plain English and get back a graded report card with specific, prioritised recommendations. Think of it as having a marketing analyst on call — one that’s read every email marketing study ever published and has instant access to all your campaign data.
MailerCloud is the first email marketing platform with built-in AI campaign analysis through MCP (Model Context Protocol). Your AI assistant connects directly to your campaign data and delivers grades, benchmarks, trends, and action plans — through natural conversation.
Getting Started in 5 Steps
You don’t need a data science degree to use AI-powered analysis. Once your MailerCloud account is connected to a compatible AI assistant (Claude Desktop, Cursor, Windsurf, or any MCP-compatible client), you’re ready to go.
- Connect MailerCloud to your AI assistant
Follow the MCP Connection Guide on the MailerCloud help centre. This takes about 5 minutes and only needs to happen once. - Run your first health check
Just ask: “How’s my email marketing doing?” — you’ll get an instant grade and overview in about 30 seconds. - Analyse your best recent campaign
Ask: “Analyse my [campaign name] campaign” — you’ll see exactly what worked and what didn’t. - Get personalised recommendations
Ask: “What are my best practices?” — the AI mines your campaign history for patterns unique to your audience. - Set your review rhythm
Weekly health checks, post-send analysis after every campaign, and a monthly deep dive. That’s the cadence that keeps performance improving.
Connect your account and ask one of these to see instant results:
“How’s my email marketing doing?”
“Analyse my last campaign and tell me what’s working”
“What are my best practices based on my campaign history?”
How Your Campaign Score Works
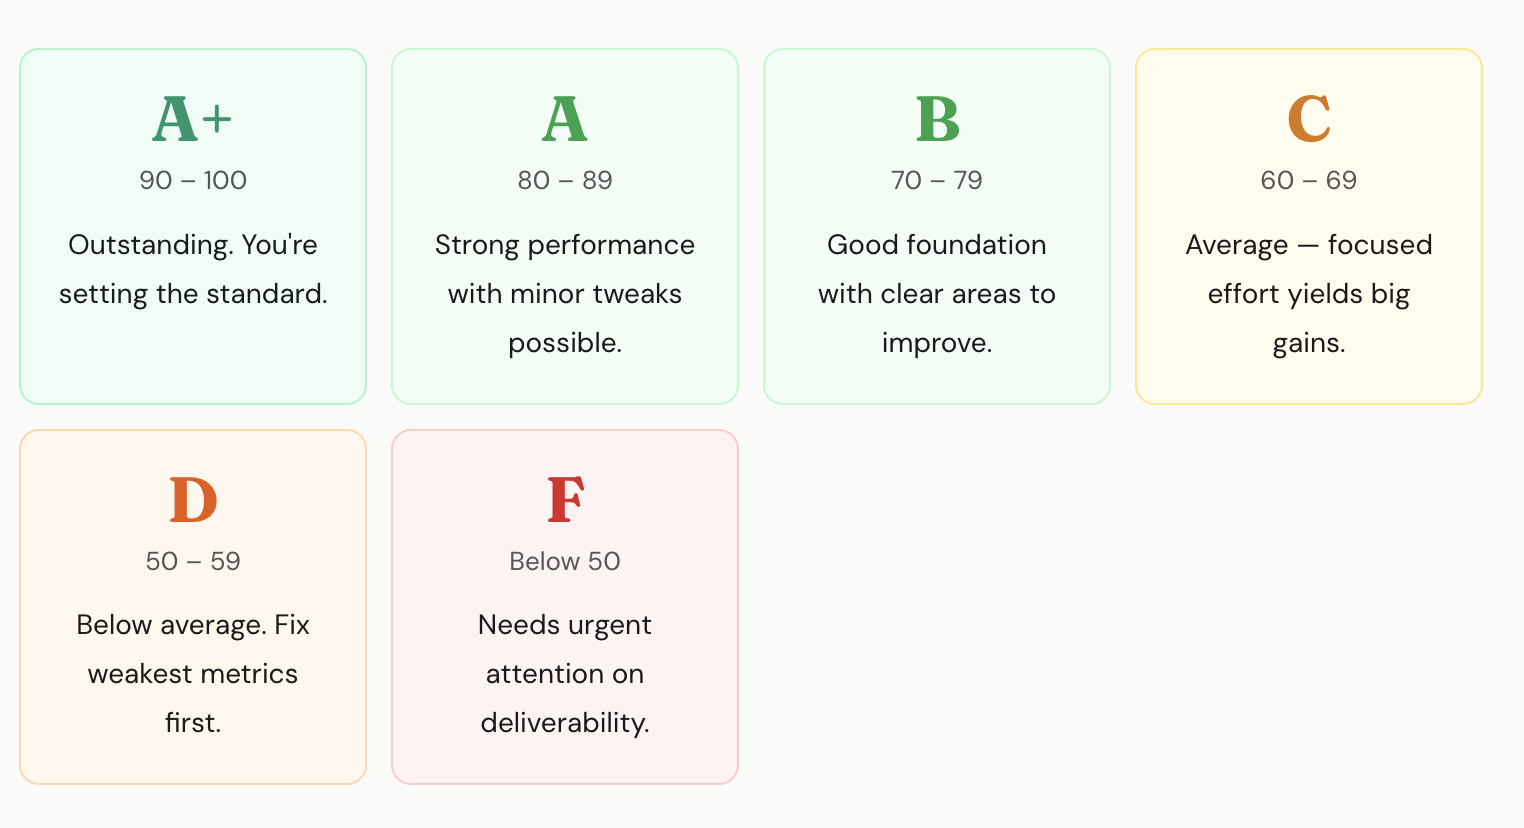
Every AI analysis report includes a performance score out of 100 and a letter grade. The score isn’t just one metric — it’s a weighted blend of six key measurements, each scored against industry benchmarks.
The Grading Scale
What Goes Into Your Score
The six metrics are weighted to reflect what matters most in email marketing. Engagement metrics (open rate and click rate) carry 50% of the weight because they directly measure whether subscribers are interacting with your content. Deliverability metrics (bounce rate, unsubscribe rate, spam complaints) carry 30% because they affect whether your emails reach inboxes at all.
| Metric | Weight | What It Measures |
|---|---|---|
| Open Rate | 25% | Subject line strength and sender reputation. Are people opening your emails? |
| Click Rate | 25% | Content and CTA effectiveness. Are people clicking your links? |
| Click-to-Open Rate | 20% | Content relevance for openers. Does your email deliver on its subject line promise? |
| Bounce Rate | 15% | List quality. Are your emails actually reaching inboxes? |
| Unsubscribe Rate | 10% | Content-audience alignment. Are subscribers opting out? |
| Spam Complaints | 5% | Sender reputation risk. Even small numbers here cause serious damage. |
Industry Benchmarks: What “Good” Looks Like
Every metric in your report is compared against cross-industry benchmarks compiled from major email marketing research. These ranges represent the band from “minimum acceptable” to “excellent” performance.
| Metric | Good Range | Needs Work | Excellent |
|---|---|---|---|
| Open Rate | 17% – 28% | Below 17% | Above 28% |
| Click Rate | 2% – 5% | Below 2% | Above 5% |
| Click-to-Open Rate | 6% – 17% | Below 6% | Above 17% |
| Bounce Rate | Below 0.5% | Above 0.5% | Below 0.2% |
| Unsubscribe Rate | Below 0.5% | Above 0.5% | Below 0.1% |
| Spam Complaints | Below 0.1% | Above 0.1% | Below 0.05% |
Mention your industry when asking for analysis — the AI contextualises results for your specific situation. A 20% open rate might be stellar for one industry and mediocre for another.
The 7 AI Analysis Tools
MailerCloud’s AI analysis suite gives you seven specialised tools. Each one answers a different question about your email marketing performance, and each is accessible through a simple conversational prompt.
1. Campaign Health Dashboard
Your 10-second health check. One number, one grade, clear status for every metric.
Start every week with this. Ask “How’s my email marketing doing?” and you’ll get an instant portfolio-level overview: overall health rating, average open and click rates, deliverability status, and the single most important thing to focus on this week.
The dashboard analyses your recent campaigns against benchmarks and flags anything that needs attention. Green across the board? You’re in great shape. Something flagged as “Needs Attention”? You know exactly where to dig deeper.
Best for: Monday morning pulse checks, quick answers for stakeholders, catching problems early.
2. Single Campaign Analysis
A complete report card for any individual campaign. Deep dive on what worked and what didn’t.
After every send, ask “Analyse my [campaign name] campaign” to get the full picture. You’ll see a TL;DR executive summary, a metric-by-metric breakdown scored against benchmarks, a “What’s Working / What’s Not” analysis, deliverability health status, and a prioritised action plan with projected impact numbers.
The projected impact section is especially useful — it tells you in concrete terms what happens if you improve. For example: “Improving open rate from 11.5% to 17% would mean approximately 440 additional opens per campaign.”
Best for: Post-send analysis, understanding surprises (good or bad), stakeholder reports.
3. Batch Analysis
Analyse your last 5-20 campaigns in one report. See trends, patterns, and list performance.
Ask “Analyse my last 10 campaigns” to get the big picture. The batch report shows your averages versus benchmarks, performance trends over time (improving, declining, or stable), a breakdown by contact list so you can see which audience segments are most engaged, and individual campaign results ranked from best to worst.
The “Performance by List” section is a revelation for most marketers. You might discover that your VIP segment scores an A while your general list scores a C — instantly telling you where to invest more time and budget.
Best for: Monthly and quarterly reviews, identifying trends, planning strategy.
4. Campaign Comparison
Head-to-head comparison of two or more campaigns. Clear winner for every metric.
After an A/B test or when you’re curious why one campaign outperformed another, ask “Compare my Spring Sale vs Summer Sale campaigns.” You’ll get a side-by-side comparison table with the winner marked for each metric, along with analysis of what the winning campaign did differently and recommendations for applying those patterns going forward.
The comparison handles different audience sizes fairly by comparing rates (percentages) rather than raw numbers. A campaign sent to 5,000 people is compared fairly against one sent to 50,000.
Best for: A/B test evaluation, understanding performance differences, proving what works.
5. Engagement Funnel
Visualises the journey from “email sent” to “link clicked.” Pinpoints your biggest drop-off.
When you know a campaign underperformed but don’t know why, the funnel tells you. Ask “Show me the engagement funnel for my newsletter” and you’ll see each stage — Sent, Delivered, Opened, Clicked — with conversion rates and drop-off percentages at each transition.
The diagnosis is straightforward. A big drop at Delivered-to-Opened means your subject line needs work. A big drop at Opened-to-Clicked means your content or CTA isn’t matching what the subject line promised. A big drop at Sent-to-Delivered means you have a list quality problem.
Best for: Diagnosing underperformance, understanding where subscribers lose interest.
6. Pre-Send Audit
Quality checklist for draft campaigns. Catches problems before they hurt your reputation.
Before scheduling any campaign, ask “Audit my [campaign name] draft.” The audit checks your subject line length (optimal at 10-50 characters), scans for spam trigger words like “free,” “act now,” and “limited time,” flags excessive capitalisation, and verifies your campaign is properly configured.
A 30-second audit can prevent your email from landing in spam folders. Even experienced marketers miss things — making this a pre-send habit eliminates avoidable mistakes.
Best for: Final quality check before every send, training new team members.
7. Best Practices Report
Personalised recommendations mined from your own campaign data. Not generic advice — your patterns.
This is the strategic powerhouse. Ask “What are my best practices?” and the AI analyses your entire campaign history to find what actually works for your audience. It identifies your top-performing subject line lengths, best send days, optimal send times, and ideal audience sizes — then packages everything into a data-backed strategy.
Most marketers are surprised by what the data reveals. You might discover that your Tuesday morning sends score 82 on average while Friday afternoons score 61. Or that subject lines under 30 characters outperform longer ones by 15 points. These aren’t generic tips — they’re patterns from your own campaigns.
Best for: Quarterly strategy planning, onboarding new team members, understanding what truly drives results.
Proving Email Marketing ROI
Every analysis tool accepts an optional cost-per-email parameter. Adding it transforms your reports from engagement metrics into business impact numbers — exactly the language leadership wants to hear.
Just add your per-email cost to any analysis prompt: “Analyse my last 10 campaigns at $0.004 per email.” Not sure what your cost per email is? Divide your monthly MailerCloud plan cost by the number of emails you send. The typical range is $0.001 to $0.01 per email.
What the Numbers Look Like in Practice
Say you sent 50,000 emails this month at $0.004 per email. Your report now includes total investment ($200), cost per open ($0.018), and cost per click ($0.118). When the AI recommends improving click rate from 3.4% to 5%, it also tells you that means approximately 800 additional clicks.
If your average order value from email clicks is $45, those 800 additional clicks could mean $36,000 in additional revenue — from the same $200 email investment. That’s the kind of number that makes leadership pay attention.
Run “Analyse my last 20 campaigns at $0.005 per email” to get total investment for the quarter, cost per open and cost per click across all campaigns, trend direction (improving efficiency or declining), and concrete improvement projections with dollar amounts. Pull these numbers directly into your QBR presentation.
Real-World Marketer Scenarios
Theory is useful, but seeing how real marketers use these tools day-to-day makes the value concrete. Here are three scenarios showing different use cases.
Priya starts every Monday morning with a health check dashboard. In 10 seconds, she knows her email programme scored a B (76/100) with click rate flagged as “Needs Attention.” She now knows where to focus this week.
After every campaign, she runs a deep dive. Her “New Arrivals Friday” campaign gets a B+ (78/100) — strong opens at 24% but weak clicks at 2.1%. The recommendation is specific: “Make your primary CTA visually prominent — use a button, not a text link.” She updates her template for next week.
For her monthly CMO report, she runs a batch analysis of her last 15 campaigns. She gets trends (improving), cost per click ($0.14), and performance by list. Her VIP segment (A grade) dramatically outperforms the general list (C grade) — she recommends expanding the VIP programme, backed by data.
Alex suspects his welcome emails are losing people early. He runs a batch analysis of his last 10 onboarding campaigns and discovers open rates start strong (28% for Welcome Email #1) but drop sharply (12% by Email #5). The trend label: “Declining.”
He drills into the weakest email with a funnel analysis and finds the biggest drop-off is at Delivered-to-Opened (88% drop). The fix: subject lines aren’t compelling enough by email #5. He rewrites with benefit-driven subjects, tests the new version, and compares old versus new.
Result: open rate jumped from 12% to 21%, clicks from 0.8% to 2.4%. That’s 90+ additional trial users engaging per month — directly impacting his conversion pipeline.
Every Monday, Maya runs a quick health check for each client — 10 minutes total for all five accounts. Any client showing “Needs Improvement” or “Critical” gets flagged for immediate attention.
For monthly client reports, she pulls batch analysis data — trends, best and worst campaigns, cost per click, and the strategic action plan — directly into her presentations. When one client questions their email budget, Maya runs a cost analysis showing email at $0.09 per click versus paid social at $1.20 and search at $2.50. The investment case makes itself.
Practical Workflows You Can Use Today
Here are five workflows that cover the most common email marketing situations. Each one tells you exactly what to ask and why.
Weekly Health Check
5 min
Start with “How’s my email marketing doing?” to get overall health. If any metrics need attention, follow up with “Analyse my last 3 campaigns” to identify which campaigns dragged down performance. Take the one action from the Top Priority recommendation and focus on it for the week.
Post-Send Campaign Review
10 min
After every send: “Analyse my [campaign name] campaign” for the full report card, then “Show me the engagement funnel” to identify where subscribers dropped off, then “Compare this to my [best campaign]” to learn what the winner did differently.
Pre-Send Quality Check
3 min
Before every send: “Audit my [campaign name] draft” to catch subject line and spam issues. Fix any failed checks. Then “Send a test email to my@email.com” for a visual check on desktop and mobile. Finally, “Schedule my [campaign] for Tuesday at 10 AM” to send at your optimal time.
Monthly Performance Review
20 min
Ask “Analyse my last 10 campaigns at $X per email” to see trends, ROI, and list performance. Follow up with “What are my best practices?” for data-driven patterns and recommendations. Then build next month’s calendar around the winning patterns the AI identified.
A/B Test Evaluation
5 min
Send two campaign versions to MailerCloud segments. Once both complete, ask “Compare [Version A] and [Version B]” for a clear winner per metric and analysis of why it won. Apply the winning elements to your full list send.
Tips for Better Results
A few practices that help you get more value from AI-powered analysis:
Use segments for targeted sends, then track by list. Create MailerCloud segments for different audience groups — VIP customers, new subscribers, dormant contacts. After sending, use batch analysis to see performance by list. You’ll know exactly which segments deserve more attention and budget.
Apply best practice patterns to your schedule. Your Best Practices report reveals your optimal send day and time. Use MailerCloud’s scheduling feature to consistently send during your winning window rather than guessing.
Clean lists based on deliverability alerts. When the Health Dashboard or Campaign Analysis flags bounce rate issues, act on it. Use MailerCloud’s list management to remove invalid addresses. Regular list hygiene directly improves your deliverability health status.
Use A/B testing with AI-powered evaluation. Set up A/B test campaigns in MailerCloud and, after both versions complete, ask the AI to compare them for a data-driven verdict on what won and why.
Mention your industry. The AI contextualises benchmarks for your specific situation. Saying “I’m in e-commerce” or “We’re a B2B SaaS company” helps the AI calibrate its recommendations to what’s realistic for your sector.

MailerCloud + AI = the smartest way to send email. Every campaign you send generates data. With AI-powered analysis, that data becomes actionable insight.